Documentation
Installation Instructions
Using the latest release
Requirements: SteamVR
- Download and install Steam
- Setup a VPN to pass through the restrictions of your network if necessary
- Setup Steam VR
- Setup Windows Mixed Reality for Steam VR
- Extract the archive from here and launch ReViVD.exe after ensuring that Windows Mixed Reality loaded properly when you plugged in your headset.
- Indicate the path to your json file that describes your binary dataset. See the JSON File Example for details on how to format your json file.
Cloning the source code
Windows Mixed Reality setup
- Plug in your HMD to launch the Windows Mixed Reality App
- Setup your headset and controllers
Unity setup
- Download and install Unity3D (you can use Unity Hub to manage several Unity versions). For optimal compatibility, use version 2019.1.9f1
- Setup Visual Studio to be the Unity Script Editor. HowTo
- Add the OpenVR (Standalone) package using the Package Manager Window.
Steam setup
- Download and install Steam
- Setup a VPN to pass through the restrictions of your network if necessary
- Setup Steam VR
- Setup Windows Mixed Reality for Steam VR
Unity project setup
- Clone the ReViVD repository; the Unity project folder is the ReViVD folder inside the main folder
- Download data into an
External Datafolder and use your VR headset to interact with it
JSON File Example
            /*
            json file example for airtraffic data adapted from http://recherche.enac.fr/~hurter/FromDaDy.html
            This json file describes your binary file to let ReViVD know how to read your dataset.
            */
            {
            //The path attribute names to use as id and/or as number of atoms, keep it void ("") if it doesn't apply to
            your dataset. The names must match with the ones in the path attributes array of this json.
            "pathAttributeUsedAs_id": "id",
            "pathAttributeUsedAs_n_atoms": "n",

            //The atom attribute names to use as x, y, z (mandatory) and/or as t and color, keep it void ("") if it
            doesn't apply to your dataset. The names must match with the ones in the atom attributes array of this json.
            "atomAttributeUsedAs_x": "x",
            //y attribute is the vertical axis (toward the sky)
            "atomAttributeUsedAs_y": "altitude",
            "atomAttributeUsedAs_z": "z",
            "atomAttributeUsedAs_t": "t",
            "atomAttributeUsedAs_color": "altitude",

            //Name of the binary file to load, must be in the same folder of this json file.
            "filename": "airtraffic",

            //If you have several binary files split by instants, turn the following option to true, set the number of
            instants per file and fill in the suffix of the first file (assuming that it is an incremental int)
            "severalFiles_splitInstants": false,
            "splitInstants_instantsPerFile": 50,
            "severalFiles_firstFileSuffix": "0001",

            //Binary endianness
            "endianness": "little",

            /* District size of the visualization
            * Used for collision detection optimization with selectors
            * Bigger districts are generally better for big selectors
            * Smaller districts are generally better for small selectors and very atom-dense visualizations
            * Try to fiddle around with those values if you find selection performance lacking.
            * Cubical districts are not mandatory but will go faster, especially on isotropic visualizations;
            * However, if a visualization is very atom-dense on only one axis, try reducing the district size on that
            axis.
            */
            "districtSize": {
            "x": 40.0,
            "y": 40.0,
            "z": 40.0
            },

            //Coordinates of the lower truncature point
            "lowerTruncature": {
            "x": -10000.0,
            "y": -10000.0,
            "z": -10000.0
            },

            //Coordinates of the upper truncature point
            "upperTruncature": {
            "x": 10000.0,
            "y": 10000.0,
            "z": 10000.0
            },

            //Number of paths in the entire dataset
            //Can be left blank / too large if unknown, at your own risks.
            "dataset_n_paths": 4309,

            //Display all paths in the dataset if set to true.
            "allPaths": true,

            //If allPaths is false, those paramaters handle the sampling of paths.
            "randomPaths": false,
            "chosen_n_paths": 4309,
            "chosen_paths_start": 0,
            "chosen_paths_end": 4309,
            "chosen_paths_step": 1,

            //Number of instants in the dataset, set it to a large number or leave it blank if unknown.
            //Will be overriden by pathAttributeUsedAs_n_atoms if it is defined.
            "dataset_n_instants": 2147483647,

            //Display all instants in the dataset if set to true.
            "allInstants": true,

            //If allInstants is false, those paramaters handle the sampling of instants.
            "chosen_instants_start": 0,
            "chosen_instants_end": 200,
            "chosen_instants_step": 1,

            //If true x and z axis will be interpreted as latitude and longitude (decimal degree)
            "useGPSCoords": false,

            //Set the origin of the visualization to be at these specific GPS coordinates
            "GPSOrigin": {
            "x": 0.0,
            "y": 0.0
            },

            //Control of the parameters of the spheres animation: radius, animation speed, beginning time of the
            animation and if spheres are display.
            "spheresRadius": 2.0,
            "spheresAnimSpeed": 1.0,
            "spheresGlobalTime": 0.0,
            "spheresDisplay": false,

            //array of asset Bundles to load with the visualization, keep it empty ([]) if it doesn't apply to your
            dataset.
            "assetBundles": [
            {
            //Name of the asset bundle
            "name": "airtraffic_map",

            //Filename of the asset bundle to load, must be in the same folder of this json file.
            "filename": "airtraffic_map",

            //If set to true, let you override the position, rotation and scale of the asset bundle.
            "overrideBundleTransform": false,
            "position": {
            "x": 0.0,
            "y": 0.0,
            "z": 0.0
            },
            "rotation": {
            "x": 0.0,
            "y": 0.0,
            "z": 0.0
            },
            "scale": {
            "x": 0.0,
            "y": 0.0,
            "z": 0.0
            }
            }
            ],

            //Path attributes array, keep it empty ([]) if it doesn't apply to your dataset.
            "pathAttributes": [
            {
            //Name of the attribute, if the attribute is used as id or n_atoms the names must match!
            "name": "id",

            //Type of the attribute : int32, float32, int64 or float64.
            "type": "int32"
            },
            {
            "name": "n",
            "type": "int32"
            }
            ],

            //Atom attributes array.
            "atomAttributes": [
            {
            //Name of the attribute, if the attribute is used as x, y, z, t or color the names must match!
            "name": "t",

            //Type of the attribute : int32, float32, int64 or float64.
            "type": "float32",

            //Position offset if the attribute is used as an axis
            "positionOffset": 0.0,

            //Size multiplier if the attribute is used as an axis; applied after position offset
            "sizeCoeff": 1.0,

            //Those parameters handle the color interpolation if this attribute is used as color
            "colorStart": "Blue",
            "colorEnd": "Red",

            //If set to true, color interpolation is done between the min and max values of this attribute
            "valueColorUseMinMax": false,

            //If valueColorUseMinMax is false, color interpolation is done between those two values
            "valueColorStart": 0.0,
            "valueColorEnd": 1.0
            },
            {
            "name": "x",
            "type": "float32",
            "positionOffset": 0.0,
            "sizeCoeff": 1.0,
            "colorStart": "Blue",
            "colorEnd": "Red",
            "valueColorUseMinMax": true,
            "valueColorStart": 0.0,
            "valueColorEnd": 1.0
            },
            {
            "name": "z",
            "type": "float32",
            "positionOffset": 0.0,
            "sizeCoeff": 1.0,
            "colorStart": "Blue",
            "colorEnd": "Red",
            "valueColorUseMinMax": true,
            "valueColorStart": 0.0,
            "valueColorEnd": 1.0
            },
            {
            "name": "altitude",
            "type": "float32",
            "positionOffset": 0.0,
            "sizeCoeff": 1.0,
            "colorStart": "Blue",
            "colorEnd": "Red",
            "valueColorUseMinMax": true,
            "valueColorStart": 0.0,
            "valueColorEnd": 1.0
            }
            ]
            }
Building Asset Bundles
To add context to the visualization such as maps and 3D models, the user creates AssetBundles and then
loads it through the JSON file. The Unity documentation to create Asset Bundles is available
here.
Be sure to check Single Pass as Stereo Rendering Mode option in the
Build Settings>Player Settings>XR Settings before building the Asset Bundles.
VR recording
To record what the user does in VR, you can use OBS with the OpenVR input plugin.
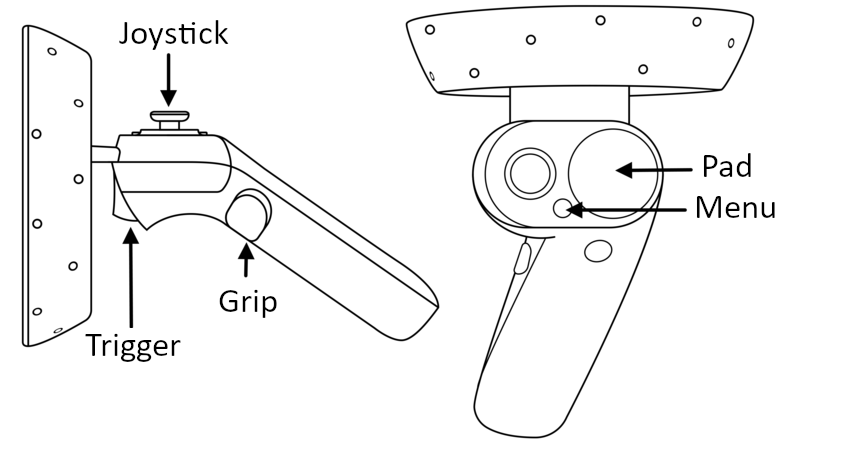
Input mapping
The next figure displays the input mapping used in ReViVD:
ReViVD has 2 modes:
- a selection mode in which the user can select trajectories with the selectors
- a creation mode in which the user can edit the primitive used into the selection process
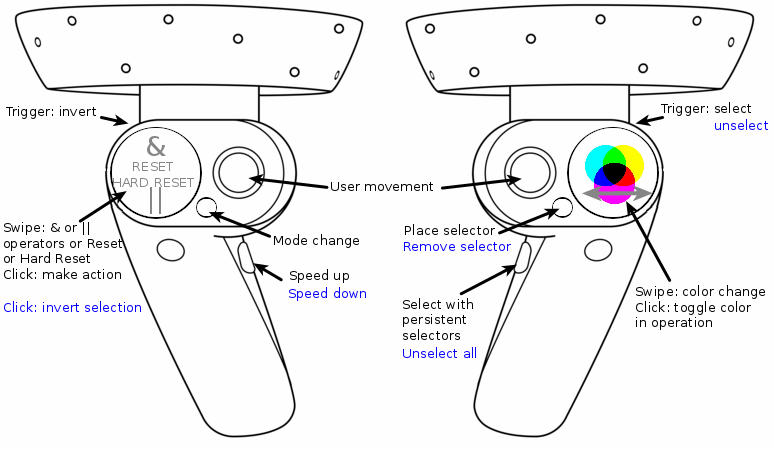
Selection mode
In selection mode, the user selects trajectories with the selectors. Like in a video game, the joysticks of the controllers monitor the movement of the user in the world space. Movement speed can be increased pressing the left grip.
To perform a selection, the user holds the right trigger; all trajectories colliding with the selector will be selected. The right menu button places a persistent selector at the current location of the selector: to select with the persistent selectors, the user presses the right grip. By swiping the right pad, the user changes the currently selection color.
The left pad provides a summary of the current logical operation the user can perform to keep only part of the currently displayed trajectories. In the center of the pad, a symbol shows whether the operation is in "AND" mode or "OR" mode. Around this symbol, colored squares show which colors are included in the operation. An operation is built by switching between its two modes and by giving it colors to operate on; to add or remove a color to the operation, the user presses the right pad, which displays the color in question. To change the operation mode, the user pulls down the "AND/OR" menu from the top part of the left pad, then presses the left pad. Once an operation is built, it can be executed by pressing the left pad.
Resetting the effects of operations requires pulling up from the bottom part of the left pad to bring up the "RESET" button, then pressing it.
Holding the left trigger allows the user to perform the opposite of most of the actions previously detailed. The next figure summarizes the input mapping in selection mode. The actions available in invert mode (while holding the left trigger) are written in blue.
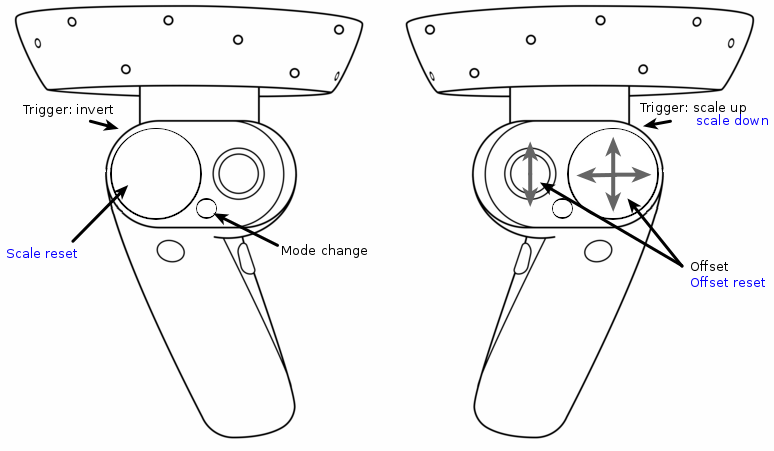
Creation mode
In creation mode, the user can edit the primitive used into the selection process. With the right joystick and pad, the user edits the offset of the primitive relative to the right controller. Holding the right trigger scales up the primitive whereas holding the left one allows the user to perform the opposite actions.
For the cuboid and cylinder primitives, with the left joystick and pad, the user can edit some parameters of the scale of those primitives: length, width, height or radius. The next figure summarizes the input mapping in the creation mode.